

Hey!
Here on NASDUCK, I’m always on the lookout for strategies backed by solid data. Today, we're having a closer look at some staggering numbers from recent research on the Exponential Moving Average (EMA).
TL;DR
Exponential Moving Average (EMA) outperforms other methods for long-term stock predictions. Key points:
50-day EMA showed impressive accuracy, with only 4.88% error for Apple stock
EMA consistently beat other methods across various stocks (AAPL, AMZN, GOOG, TSLA, etc.)
For long-term predictions, EMA (11.51% error) outperformed AI-based LSTM (26.54% error)
Use 50-day EMA as your primary tool; calculate daily using the provided formula
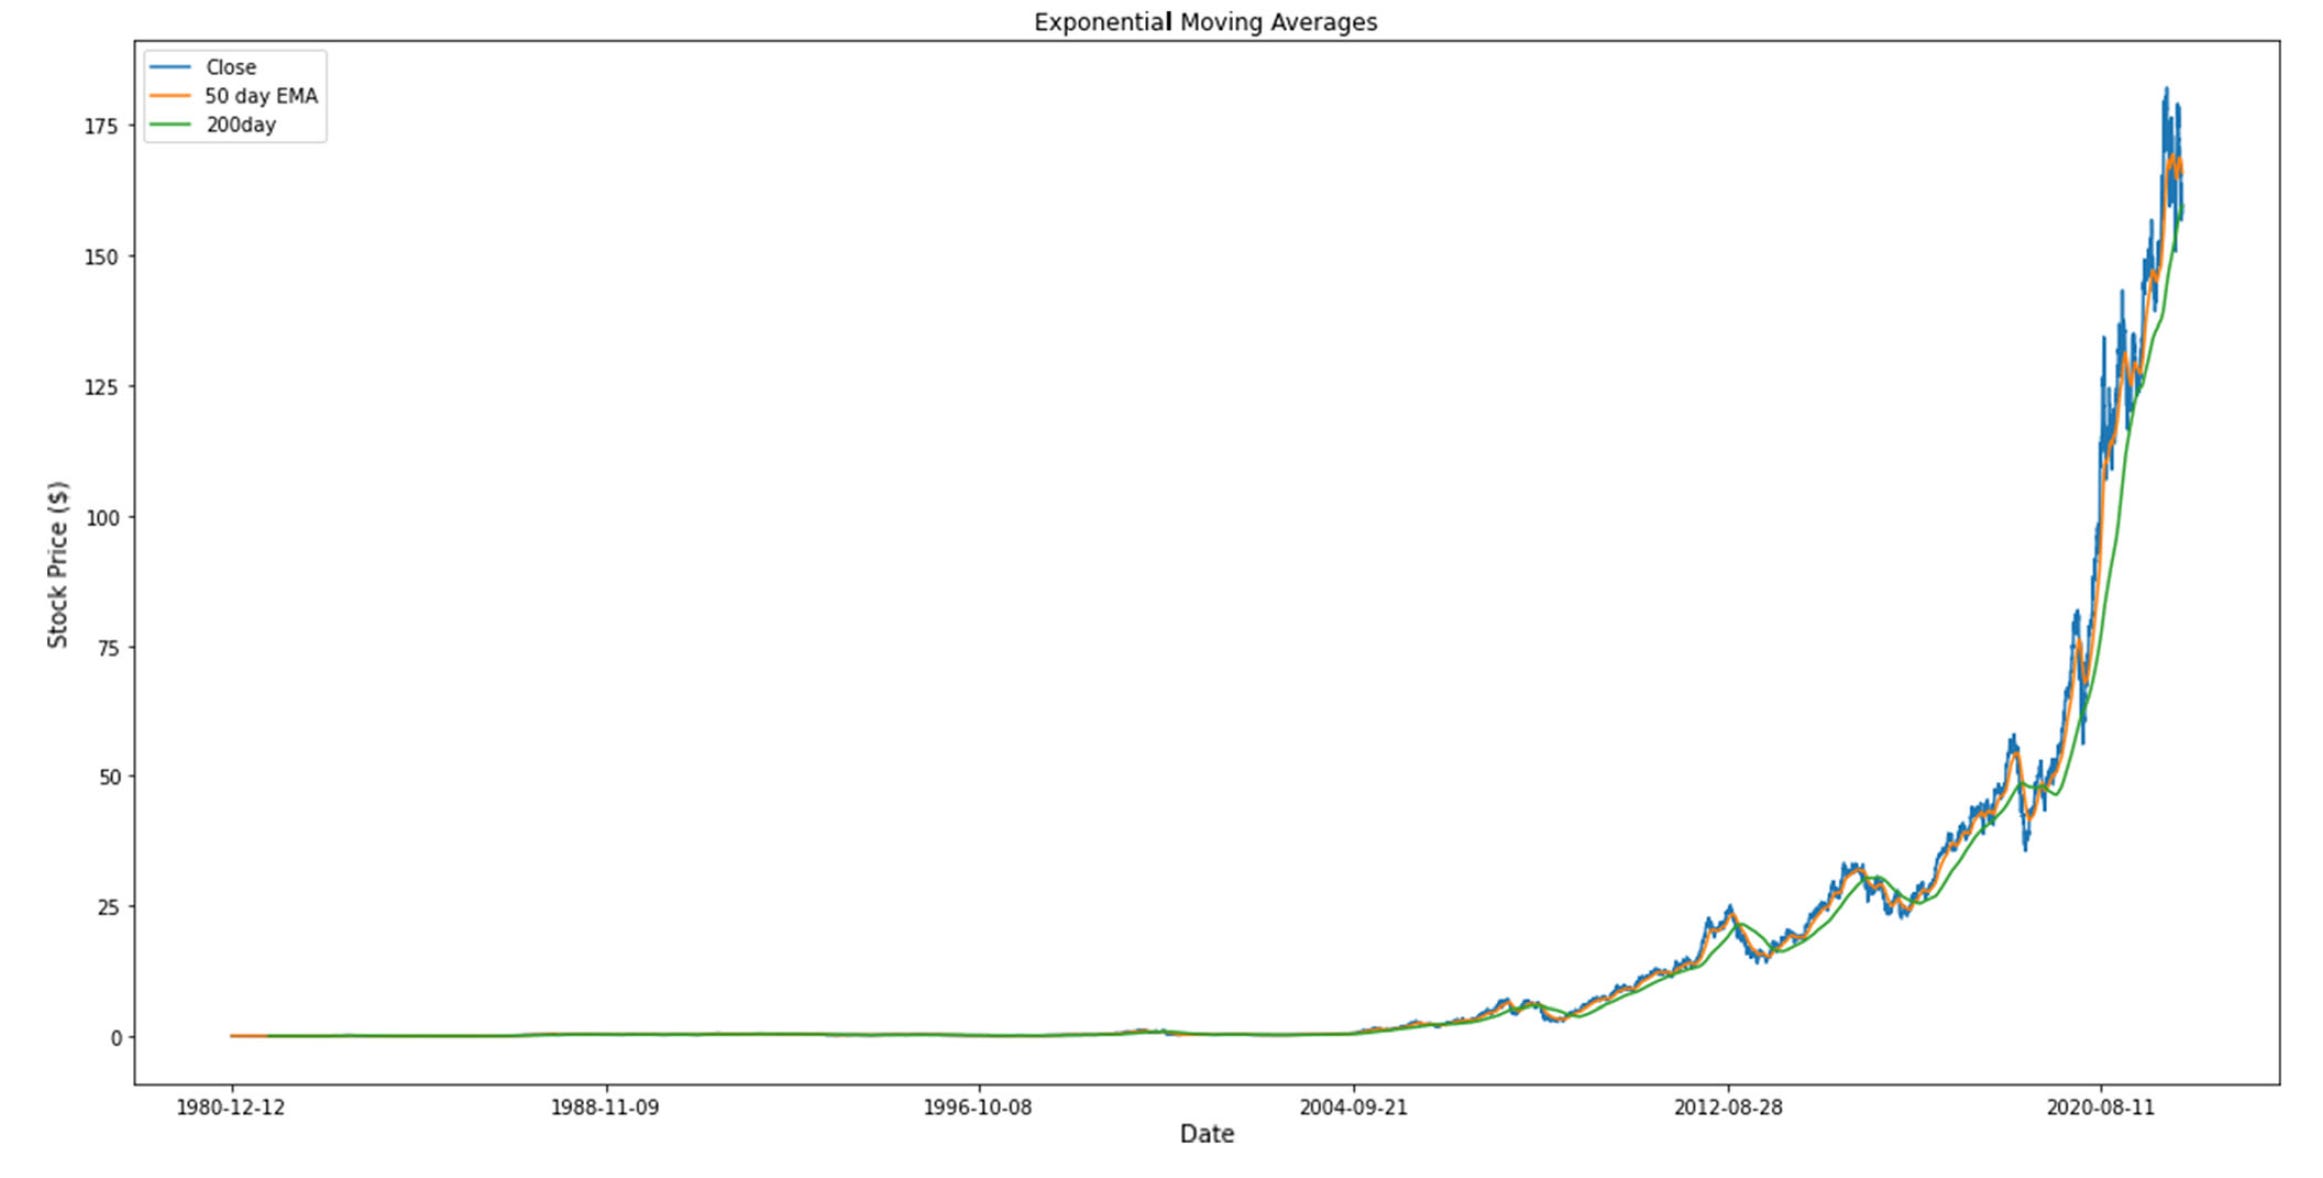
Implement crossover strategies with 50-day and 200-day EMAs for potential buy/sell signals
EMA works best for stable stocks but is still valuable for volatile ones
While AI excels in short-term predictions, stick with EMA for long-term forecasts
Combine EMA with other analyses for a comprehensive investment strategy
EMA Shines in Long-Term Predictions
A study published in Neural Computing and Applications journal has revealed some compelling insights:
EMA outperformed other methods in long-term stock price predictions across multiple major stocks.
For Apple (AAPL) stock, EMA showed an impressive error rate of just 4.88% for long-term predictions.
Even for more volatile stocks like Tesla (TSLA), EMA maintained a respectable 12.99% error rate for long-term forecasts.
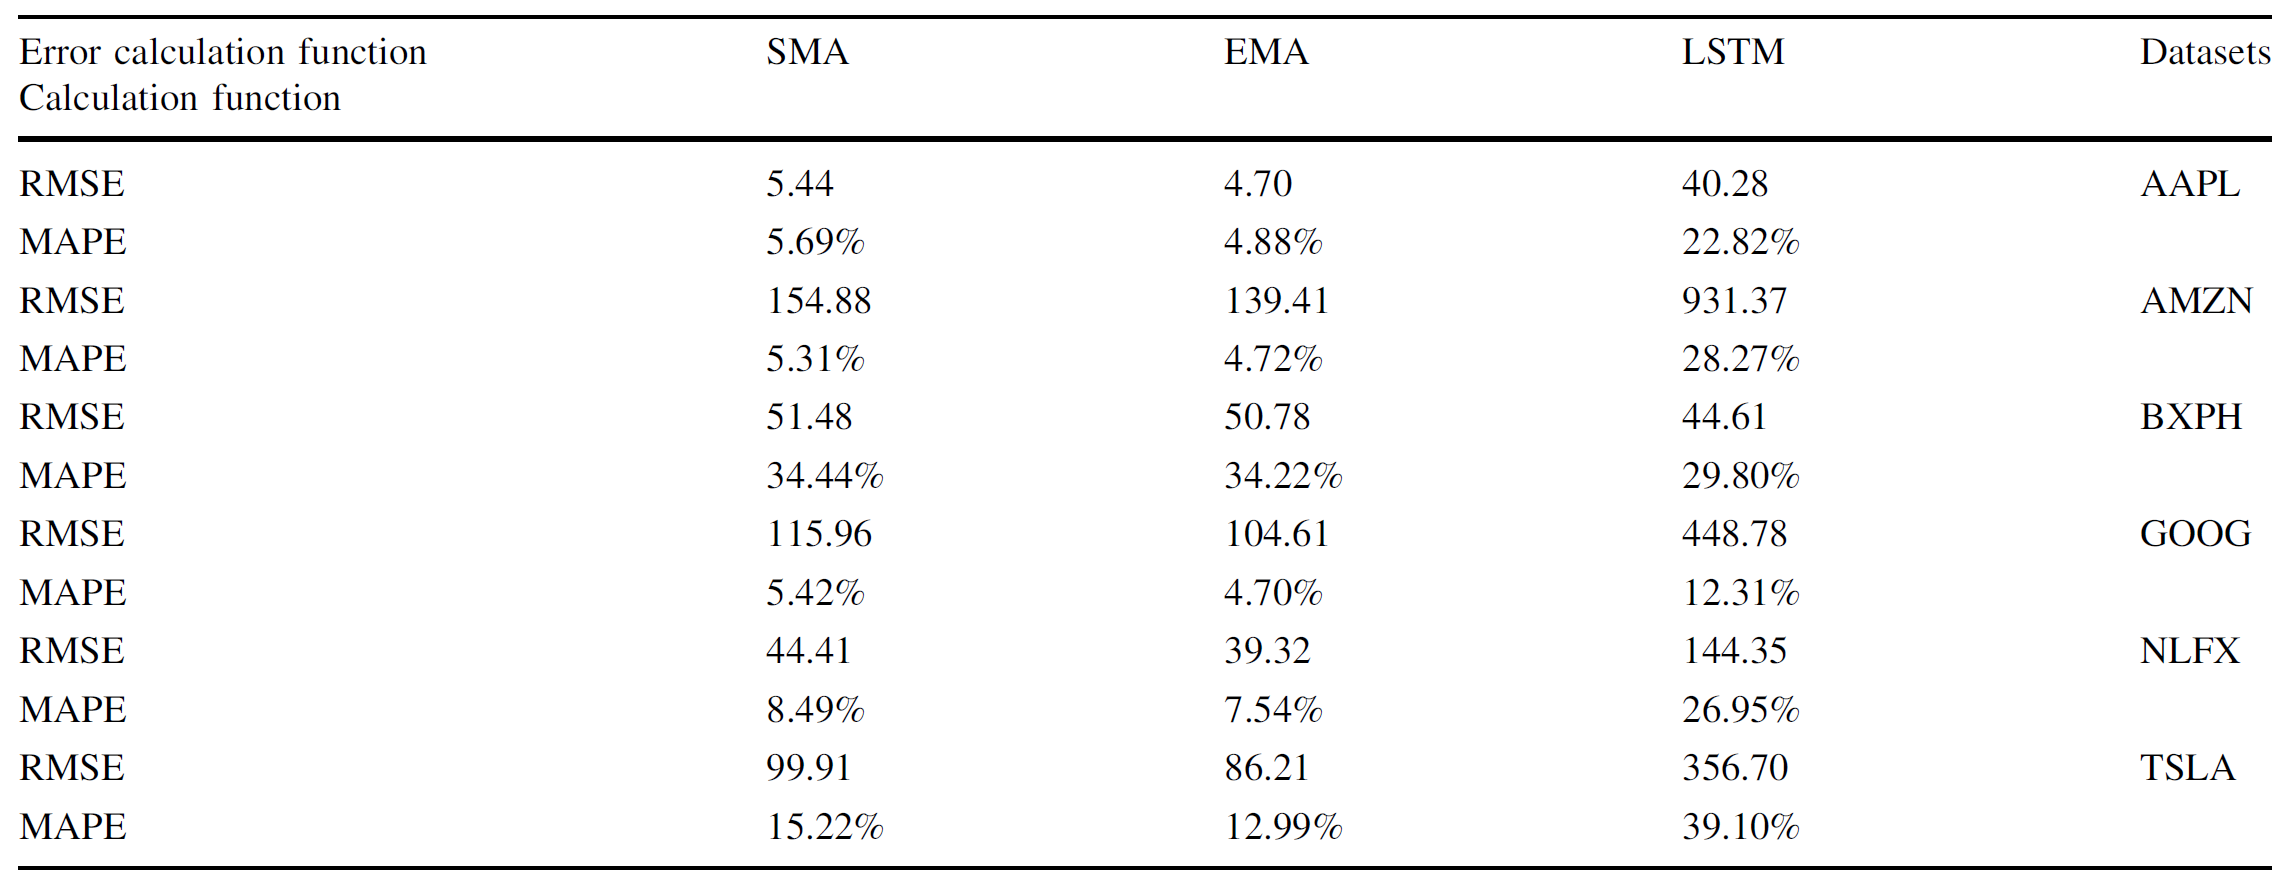
With error rates consistently lower than other methods, EMA proves to be a reliable tool for long-term stock analysis.
EMA's effectiveness varies by stock. It's particularly strong for stable blue-chip stocks like Apple, but still valuable for more volatile stocks.
Across all six stocks studied (AAPL, AMZN, BXPH, GOOG, NFLX, TSLA), EMA showed lower error rates than Simple Moving Average (SMA) for long-term predictions.
Actionable Advice with Specific Numbers
50-Day EMA Focus: The study used a 50-day EMA for their calculations. Make this a central part of your analysis toolkit.
AAPL Strategy: For Apple stock, a 50-day EMA yielded a 4.88% error rate. Use this as a benchmark for your AAPL predictions.
AMZN Insights: Amazon showed a 4.72% error rate with 50-day EMA. Consider this when analyzing e-commerce giants.
Volatile Stock Approach: For more volatile stocks like Tesla (12.99% error rate), use EMA in conjunction with other indicators for a more comprehensive view.
Putting EMA to Work: The Secret Formula
If you want to calculate your 50-day EMA manually, use this formula:
Keep reading with a 7-day free trial
Subscribe to NASDUCK to keep reading this post and get 7 days of free access to the full post archives.